I wasted a day on CSS selector performance to make a website load 2ms faster
Posted on in WebI’ve been doing some performance tinkering at work. It’s written in Next.js and employs judicious use of Server Components to minimise client-side JS. I’m really proud of it. It scores ~90 on Lighthouse mobile, which for Next.js isn’t too bad. Sure, it pains me to see the tiny amount of client-side interaction resulting in such a large bundle, but it’s the price we pay for developer convenience, apparently. But I digress.
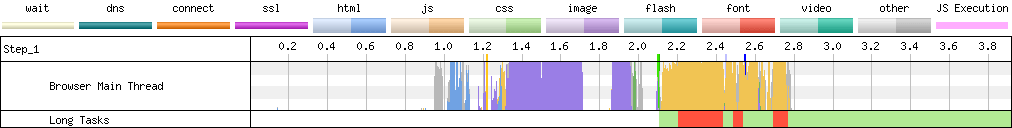
I was showing some traces to a colleague, and we were looking intently at the considerable gap between the CSS being downloaded, and the website becoming visible.
My hunch was the bundle of <script>s than Next generates were being parsed at the point of CSS rendering, causing the main thread to choke. Incredibly, you still can’t swap async to defer when using the the App Router (despite it being possible with their previous router), which would almost certainly close this gap. But I digress.
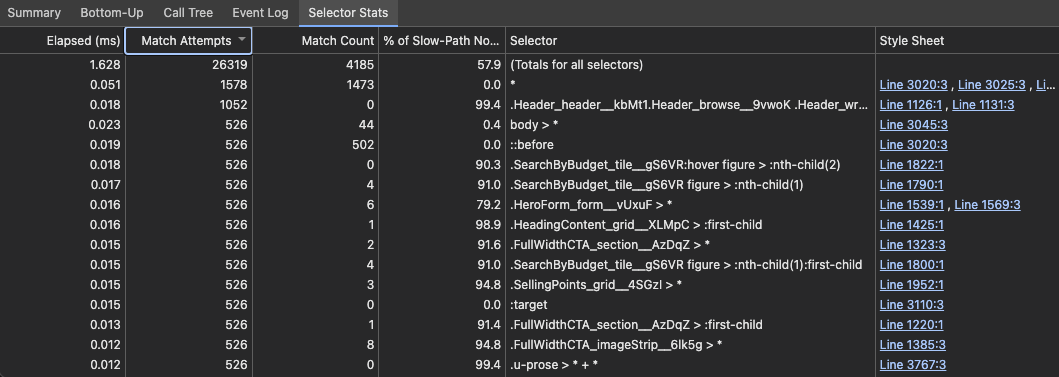
He found an option in the “Performance” tab in dev tools called “Enable CSS selector stats (slow)”, which analyses every CSS selector and pops them in a table.
In addition, the trace showed an alarming blob of purple where the main thread locked up under the label of “Recalculate style”. 270ms of delay just to calculate styles.
Goodness, I thought, that’s some tasty low hanging fruit.
Now, I know in my heart that CSS selector performance isn’t something to worry about. I’ve heard it again and again that browsers are incredibly efficient at handling CSS selectors these days, and yet the graph didn’t (appear to) lie; 270ms to recalculate styles on every DOM change and page load. Against my better judgement, on a day where I didn’t have a tonne of other work to do, I felt I had to go deeper.
I was particularly drawn to the column “Match attempts” compared to “Match count”. Some selectors were attempting to match against hundreds of DOM nodes, but still end up not matching many/any elements. This fruit was looking tastier by the second.
The common culprits were any selector ending in *, :last-child, :first-child, :nth-child, which included the infamous owl selector, being used for flow spacing amongst other things.
The penny suddenly dropped onto a piece of knowledge I’d squirrelled away years ago. Selectors are read from right to left in CSS. This form of bottom-up parsing is more efficient for the browser when matching to DOM nodes. However, you can begin to see why a selector like .parent > * + * is flagged as one of the more inefficient ones. Read backwards, the browser sees the selector as follows:
*- this matches all elements* + *- this narrows it to all elements that follow another (so almost all elements).parent > * + *- finally, this narrows it down to any direct children of.parentthat follow another child
So this selector attempts to match on every DOM node, but might only actually match five elements on the page.
Now, at this point, I should’ve seen the column marked ‘Elapsed (ms)’ with values such as 0.013 and thought, hmm, that doesn’t seem very long, nor could all the selectors really add up to 270ms. But by now, the low hanging fruit looked far too tasty, and I had a hankering for some refactoring.
I took the table of selectors and calculated which selectors had the greatest difference between match attempts and elements found, and began working through those. A few were fed through our design system, but many came from my codebase.
Through much inversion of control and additional classes/data attributes, I updated almost all instances of :last-child and *. I made a release to our design system fixing the oh-so-inefficient selectors and marvelled at the improvement.
Recalculate style / Before: 270ms / After: 40ms
For a few minutes, I felt like Indiana Jones staring at the holy grail. 230ms of savings from some CSS selector changes. This felt significant. And yet, the niggling phrase of “CSS selector efficiency is not something to worry about in 2024” kept ringing through my head.
I ran the before/after through WebPageTest and to my surprise (and lack of surprise), nothing significant had changed.
It was at this point that the second penny dropped and I realised I’d been duped by a graphing misunderstanding and my own enthusiasm for improving frontend performance. When clicking “Enable CSS selector stats (slow)”, I assumed it took longer to record the rendering process, but would provide the results as if they were not being profiled. I then realised that the graph was showing a big purple blob because I had the checkbox enabled. Suffice to say, I felt like a right doughnut.
I ran it all again without that option enabled and here are the fruits of my labour:
Recalculate style / Before: 11.95ms / After: 10.23ms
Whoop-de-doo
But if, somehow, you’re browsing this site with CSS selector stats enabled, and find it to be a snappy experience, you’re welcome.
Posted on in Web